


Just two days after Cboe announced that it was going to delist bitcoin futures, the cryptocurrency’s spot market turned near-term bullish.
The BTC/USD exchange rate surged 3.30-percent in the past 24 hours to establish a session high towards 4069. Simultaneously, the rest of the cryptocurrency market also went green, with Bitcoin Cash leading the bull pack with 17.81% gains, followed by Litecoin, EOS, and Ethereum that rose 8.44-, 5.47-, and 6.25-percent, respectively. On the whole, the cryptocurrency market capitalization added up to $6 billion worth of investments in a day.
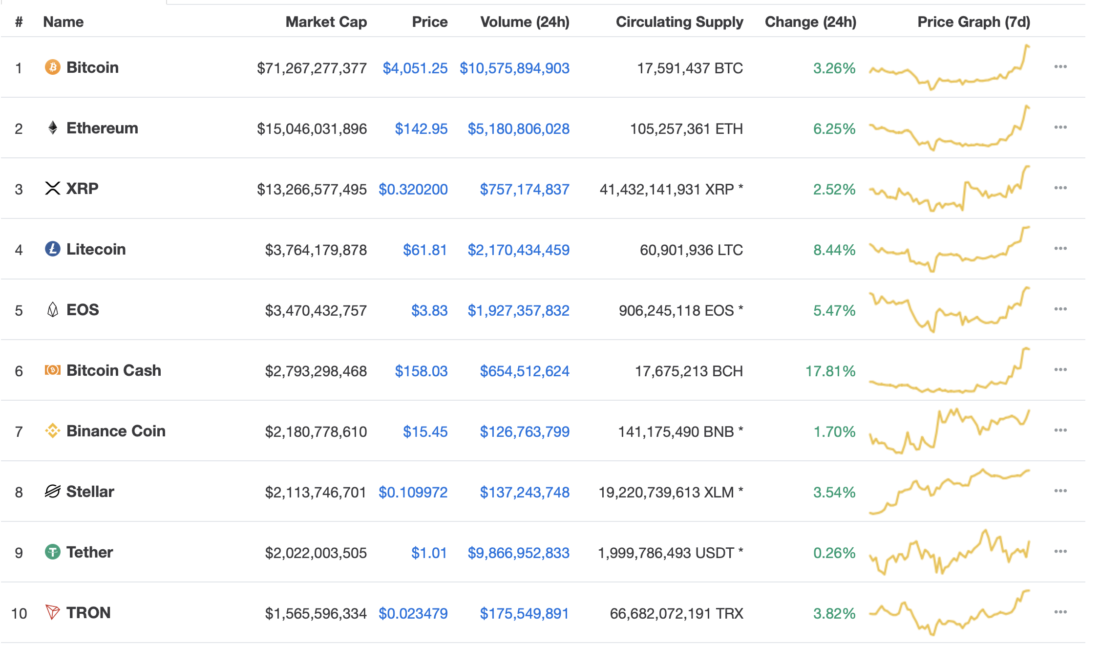
All Top Cryptocurrencies Trended in Green This Saturday | Source: CMC
Not the First Time
The bitcoin rally follows an overstretched stable action since February 25. The cryptocurrency’s significant levels remain unchanged as it traded inside a $200-range for almost two weeks. Before that, bitcoin failed when it came to piercing through key resistance areas. At the same time, the cryptocurrency received equally stronger support from bulls on every downside correction. Have a look at this chart to understand further.
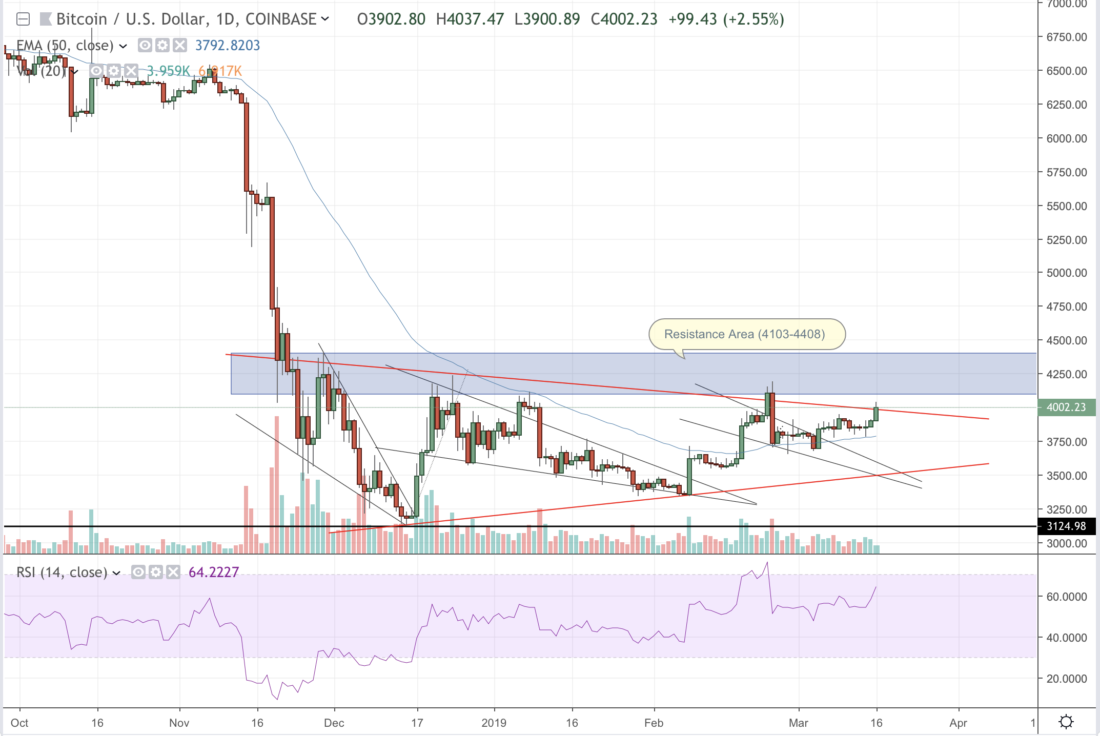
BTC/USD Analysis | Source: Bitfinex.com
One can notice that bitcoin is trending inside a symmetrical triangle defined by red trendlines. It is providing traders a clear understanding of the ongoing price action. As close as the bitcoin price gets to the triangle’s apex, the lesser the volume becomes. At the same time, every upside attempt is failed by a stronger red resistance trendline – barring a few instances of false breakouts. From mid-December to now, the BTC/USD market has seen six of such breakout attempts. The market is now in its seventh one.
The bitcoin market is somewhat mirroring Martin’s prediction. While there has been a modest volume spike on a daily chart, it is still not enough to kickstart a breakout run. Let’s have a closer look:
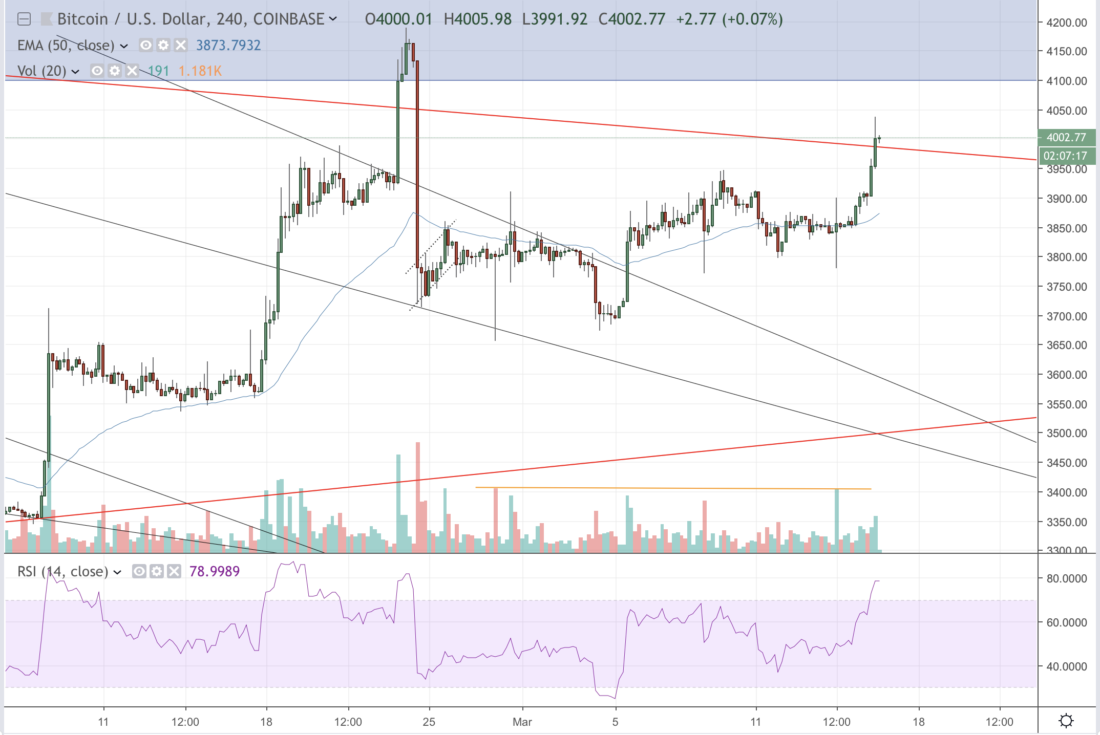
BTC/USD Analysis | Source: Bitfinex.com
The orange bar reflects the highest 4H trading volumes in the past two weeks. These are not comparable to the mad spikes the market saw between February 20 and 25 trading hours. Atop that, the BTC/USD market is below the orange bar and, at the same time, its Relative Strength Index, the momentum indicator, is already overbought.