- Bitcoin price formed a solid support near the $3,560 level and moved higher against the US Dollar.
- There is a crucial bearish trend line in place with resistance near $3,850 on the 4-hours chart of the BTC/USD pair (data feed from Kraken).
- The pair could continue to move higher towards the $3,850 and $4,000 levels in the near term.
Bitcoin price is showing positive signs above the $3,600 support against the US Dollar. BTC/USD could accelerate gains once there is a break above $3,800 and $3,850.
Bitcoin Price Analysis
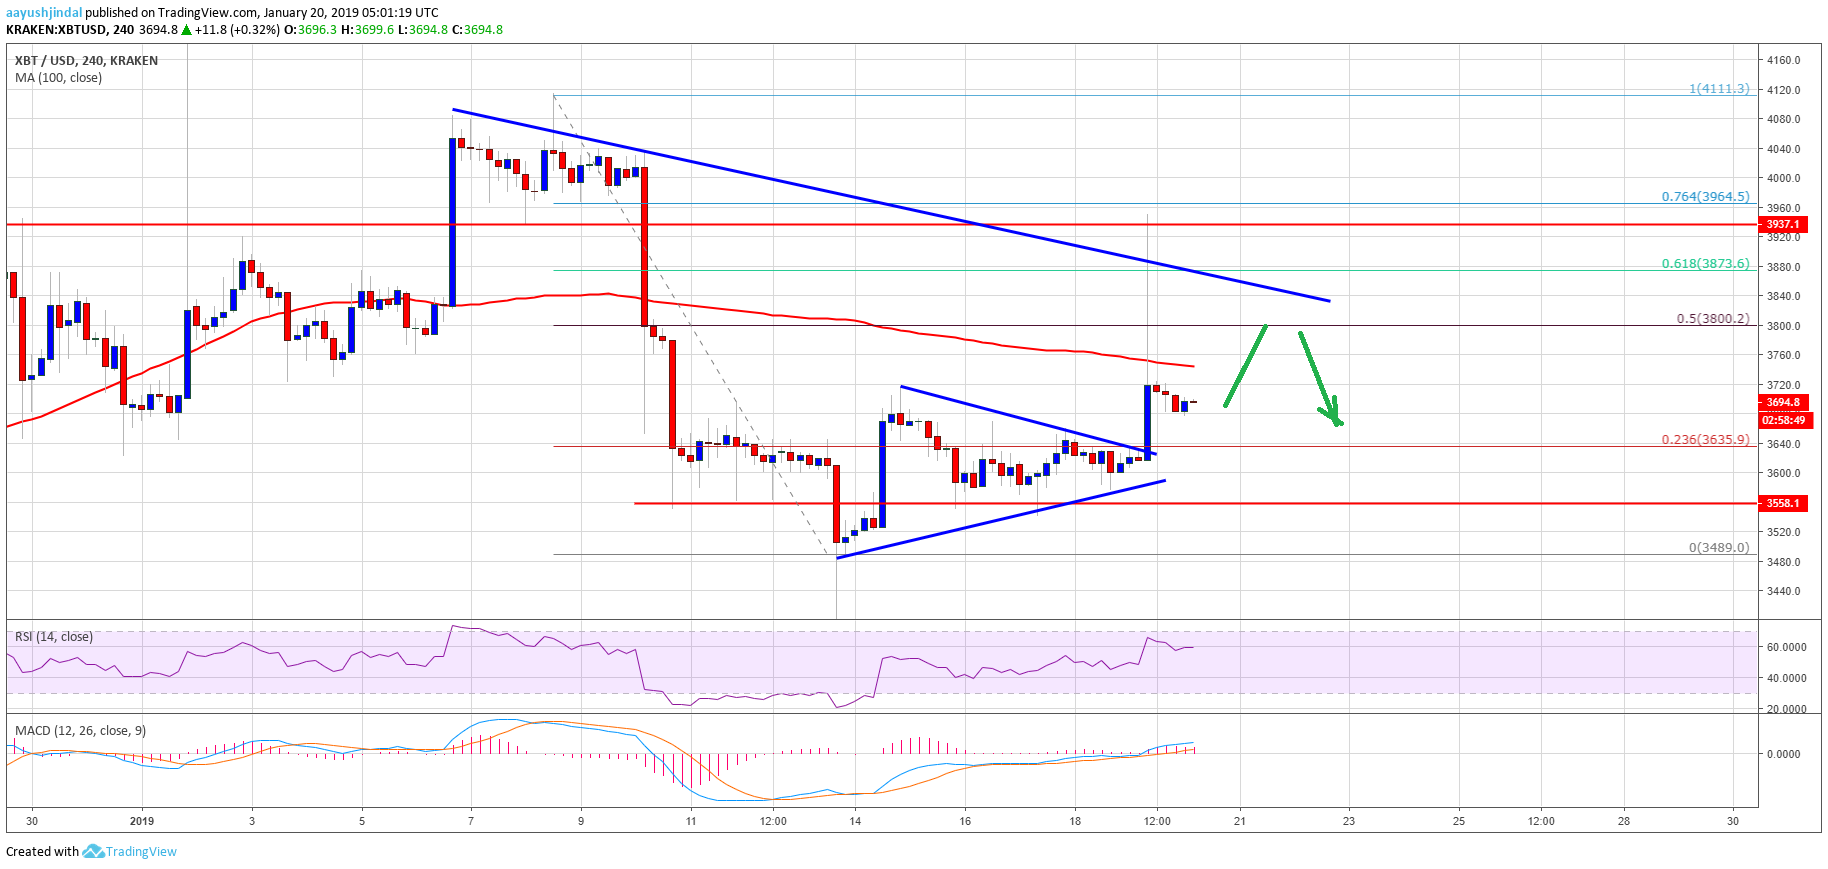
This past week, bitcoin price dived below the $3,560 support level against the US Dollar. However, the BTC/USD pair found a strong buying interest near the $3,480 and $3,500 support levels. As a result, there was a sharp bounce above the $3,560 level. The price climbed above the $3,600 and $3,640 resistance levels. Besides, there was a break above the 23.6% Fib retracement level of the last decline from the $4,111 high to $3,489 low. Later, there was a consolidation pattern formed above the $3,600 level.
Finally, there was a break above a contracting triangle with resistance at $3,635 on the 4-hours chart of the BTC/USD pair. The price tested the 100 simple moving average (4-hours) and the $3,800 resistance level. However, the price failed to stay above the 50% Fib retracement level of the last decline from the $4,111 high to $3,489 low. There was a fresh downside move below the $3,700 level and the price is currently trading in a range. On the upside, there are many hurdles, starting with $3,750 and ending with $3,850. Furthermore, there is a crucial bearish trend line in place with resistance near $3,850 on the same chart.

Looking at the chart, BTC price is clearly showing positive signs above the $3,600 support level. Having said that, a proper close above the $3,800 and $3,850 resistance levels is must for more gains.
Technical indicators
4-hours MACD – The MACD for BTC/USD is currently placed in the bullish zone, with positive signs.
4-hours RSI (Relative Strength Index) – The RSI for BTC/USD is currently well above the 50 level.
Major Support Level – $3,560
Major Resistance Level – $3,850


