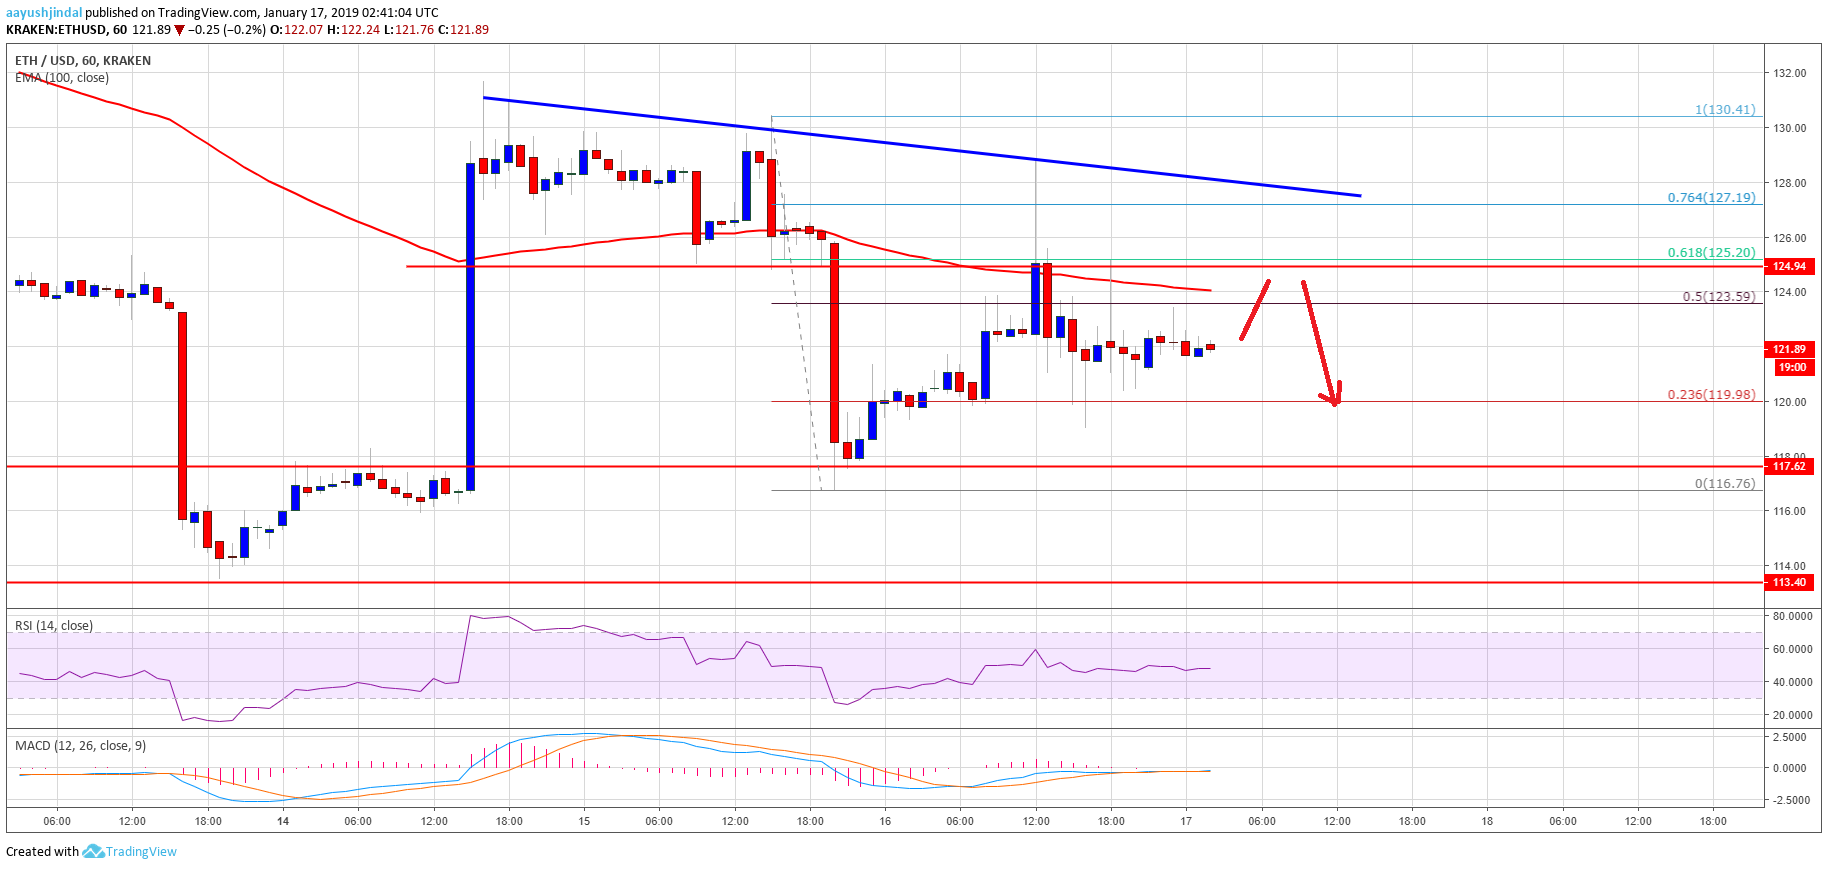
After an increase in the bearish sentiment, ETH price dropped towards the $118 support against the US Dollar. The ETH/USD pair found a lot of buyers near the $117-118 zone, resulting in a decent upside correction. The price jumped sharply above the $120, $124 and $127 levels. Buyers were successful in piercing the 50% Fib retracement level of the recent decline from the $130 swing high to $117 swing low. There was a spike above the 100 hourly simple moving average and $128.
However, the price failed to stay above the $127 resistance and later declined. There was a rejection near the 76.4% Fib retracement level of the recent decline from the $130 swing high to $117 swing low. The price is currently trading below the $125 resistance and the 100 hourly simple moving average. Moreover, there is a new connecting bearish trend line formed with resistance at $127 on the hourly chart of ETH/USD. Therefore, there are a few important hurdles near the $124, $125 and $127 resistance levels. A clear break and close above the trend line is must for an acceleration towards $130 and $135.

Looking at the chart, ETH price is facing tough resistances on the upside near the 100 hourly SMA and $127. Having said that, it remains well bid on the downside near the $120, $118 and $117 support levels.
ETH Technical Indicators
Hourly MACD – The MACD for ETH/USD is currently flat in the bearish wave, with no major bullish signal.
Hourly RSI – The RSI for ETH/USD is flirting with the 50 level, with chances of an upward move.
Major Support Level – $113
Major Resistance Level – $124


