


- Ripple price tested the $0.3050 support level and later bounced back above $0.3120 against the US dollar.
- There was a break above a major bearish trend line with resistance at $0.3160 on the hourly chart of the XRP/USD pair (data source from Kraken).
- The pair is currently placed nicely above $0.3160, but it must break the $0.3220 resistance for more gains.
Ripple price started a decent recovery against the US Dollar and Bitcoin. XRP/USD is now facing a major hurdle near $0.3220 and the 100 hourly simple moving average.
Ripple Price Analysis
Recently, there was a sharp downside reaction below the $0.3100 support level in ripple price against the US Dollar. The XRP/USD pair declined below the $0.3080 support and tested the $0.3050 area. A new weekly low was formed at $0.3047 and later the price bounced back nicely. It climbed above the $0.3080, $0.3100 and $0.3130 resistance levels to move into a positive zone. There was even a break above the 76.4% Fib retracement level of the last drop from the $0.3217 high to $0.3047 low.
Moreover, there was a break above a major bearish trend line with resistance at $0.3160 on the hourly chart of the XRP/USD pair. The pair retested the $0.3217 swing high and the 100 hourly simple moving average. However, there was no break above the $0.3220 resistance and the price is currently consolidating below the 100 hourly SMA. It seems like there could be a short term correction towards the $0.3160 or $0.3140 support levels. Later, the price may bounce back and attempt to surpass the $0.3220 barrier. The next stop for buyers could be near the $0.3320 level. It represents the 1.618 Fib extension level of the last drop from the $0.3217 high to $0.3047 low.
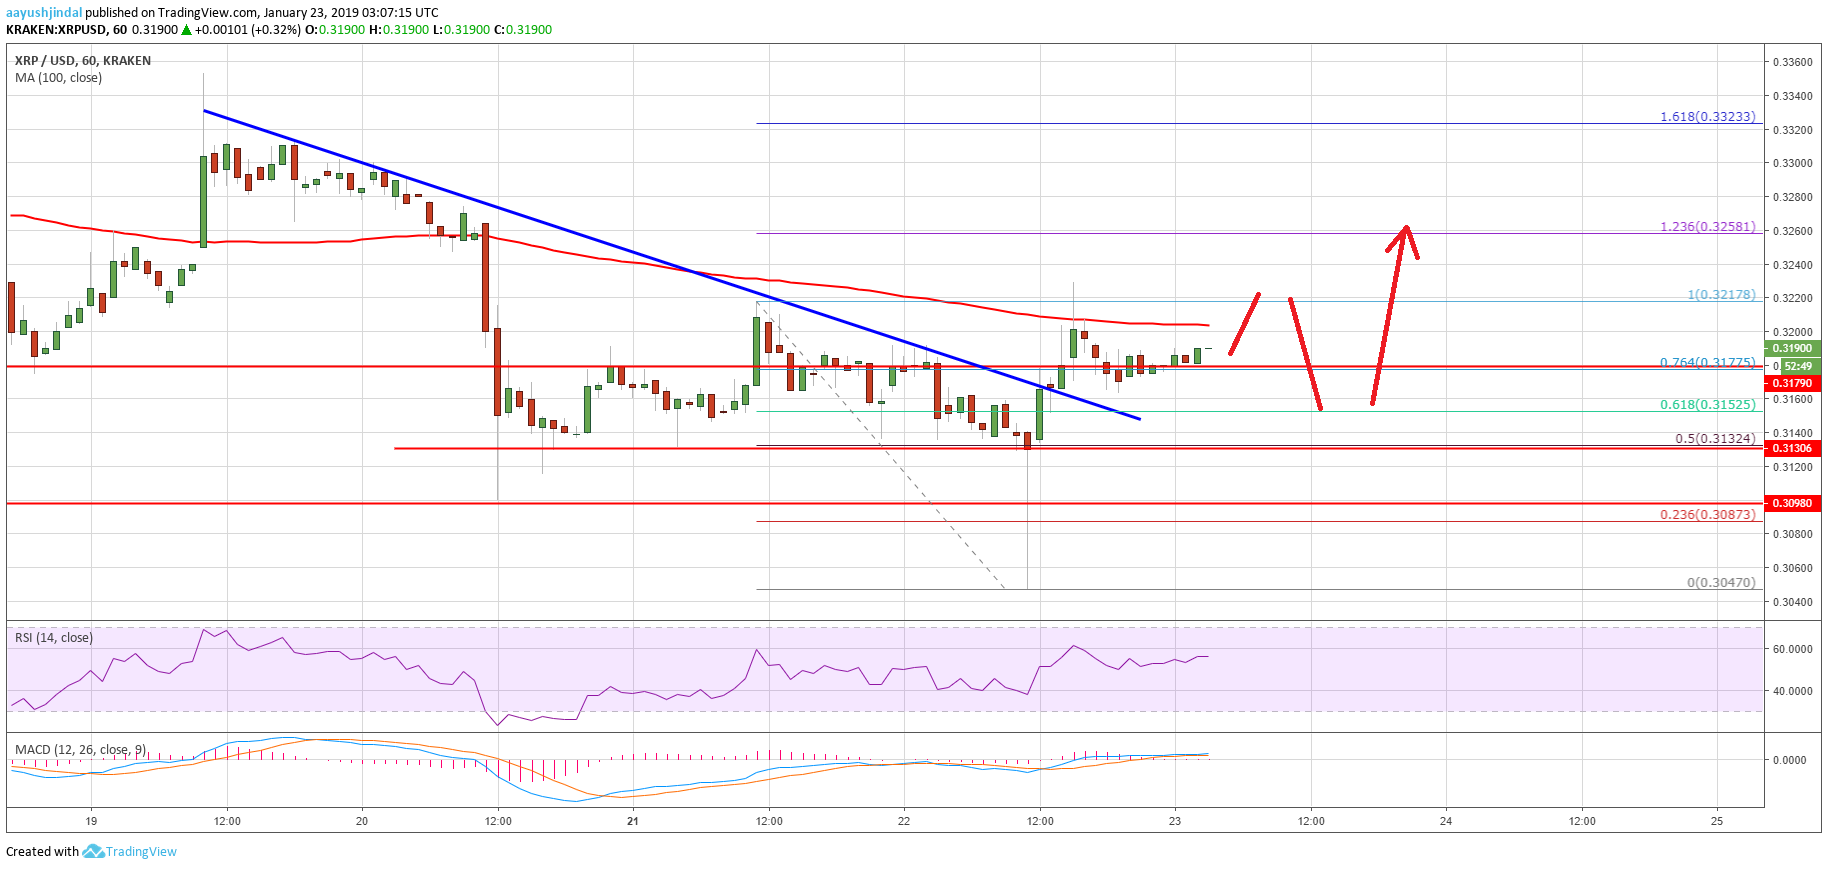
Looking at the chart, ripple price is slowly moving into a positive zone above $0.3180. However, a clear break above the $0.3220 barrier is must for more gains in the near term.
Technical Indicators
Hourly MACD – The MACD for XRP/USD is slowly moving into the bearish zone.
Hourly RSI (Relative Strength Index) – The RSI for XRP/USD is currently well above the 50 level.
Major Support Level – $0.3140
Major Resistance Level – $0.3220