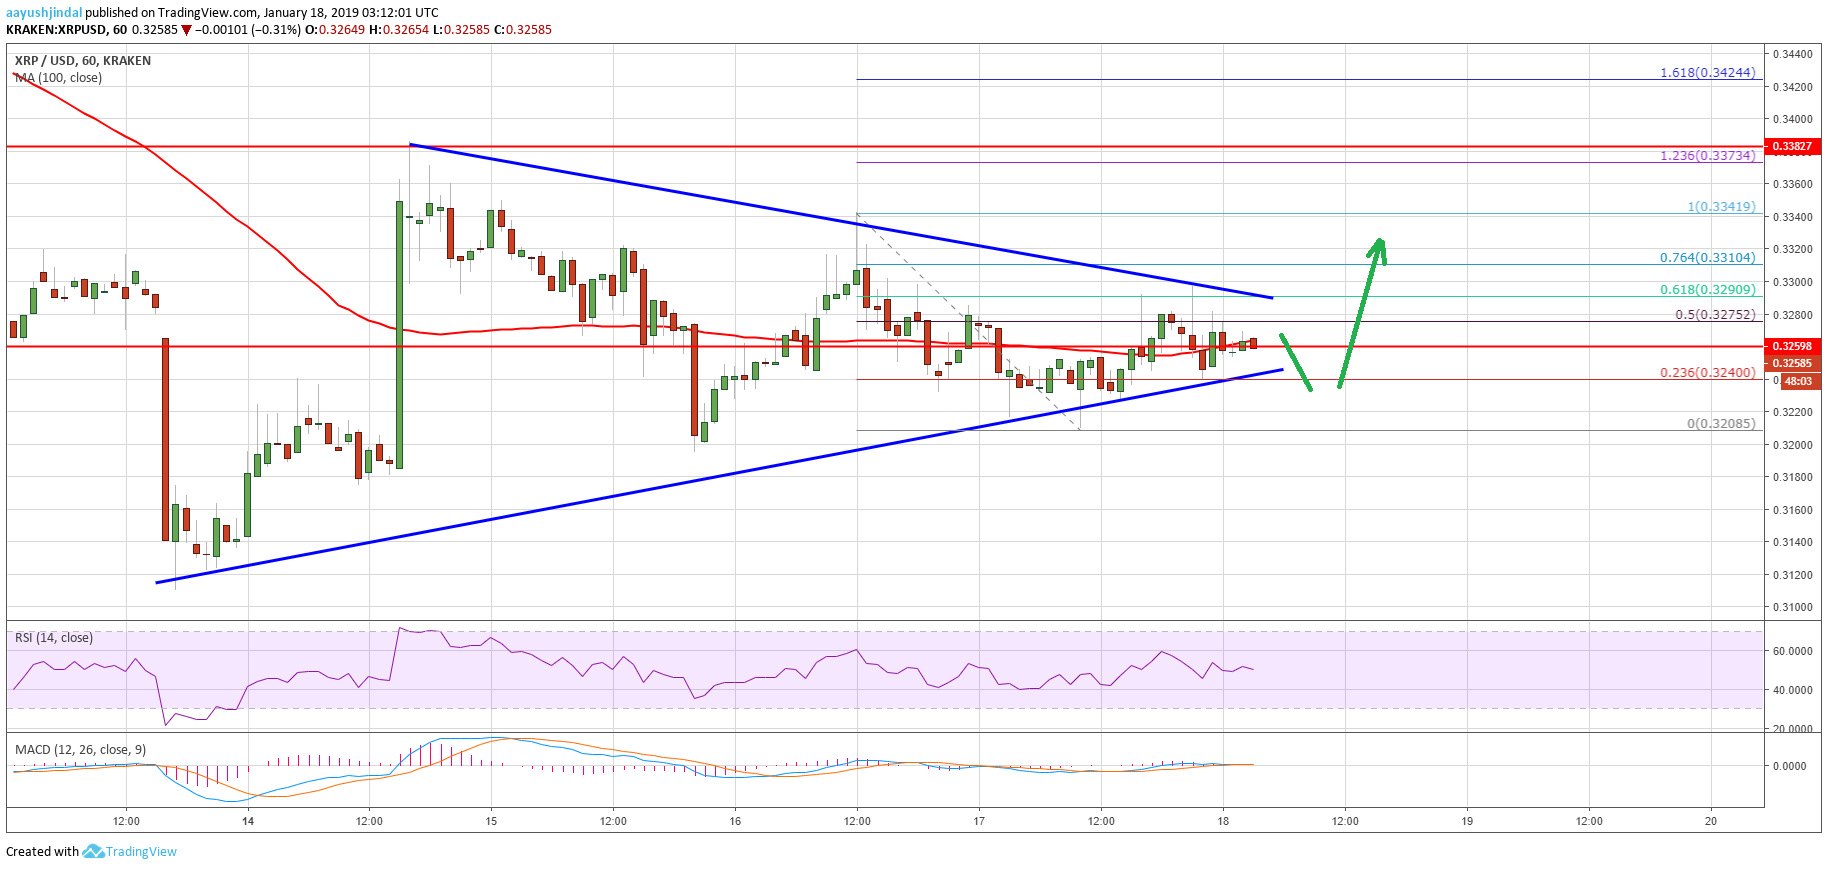
During the past few hours, there were mainly range moves above the $0.3160 pivot in ripple price against the US Dollar. The XRP/USD pair traded a few points above the $0.3280 and $0.3300 resistance levels. However, there was no major upward move and the price topped near the $0.3340 level. Later, there was a downward move and the price declined below the $0.3260 support. There was also a break below the $0.3220 support and the 100 hourly simple moving average.
A low was formed at $0.3208 and later the price corrected higher. It recently broke the 50% Fib retracement level of the recent drop from the $0.3341 high to $0.3208 low. However, the upward move was capped by the $0.3280 and $0.3290 levels. The price also failed to clear the 61.8% Fib retracement level of the recent drop from the $0.3341 high to $0.3208 low. At the outset, there is a major contracting triangle formed with resistance at $0.3290 on the hourly chart of the XRP/USD pair. A successful close above the $0.3290 and $0.3300 resistance levels may clear the path for more gains. The next major resistance is at $0.3380, above which the price may test $0.3600.

Looking at the chart, ripple price is clearly preparing for the next break either above $0.3300 or below $0.3200. As long as XRP is above $0.3160, there are high chances of a break above $0.3300.
Technical Indicators
Hourly MACD – The MACD for XRP/USD is currently flat, with no major bullish signal.
Hourly RSI (Relative Strength Index) – The RSI for XRP/USD is flirting with the 50 level, with a few bearish signs.
Major Support Level – $0.3160
Major Resistance Level – $0.3300


