Ethereum and other cryptocurrencies have captured the imagination of technologists, financiers, and economists. Digital currencies are only one application of the underlying blockchain technology. Earlier this year, we made the Bitcoin dataset publicly available for analysis in Google BigQuery. Today we’re making the Ethereum dataset available.
Like its predecessor, Bitcoin, you might think of the Ethereum blockchain as an immutable distributed ledger. However, creator Vitalik Buterin extended its set of capabilities by including a virtual machine that can execute arbitrary code stored on the blockchain as smart contracts.
With regards to the system architecture, Ethereum resembles Bitcoin in that it primarily serves to record immutable transactions. Both are essentially OLTP databases, and provide little in the way of OLAP (analytics) functionality. However, the Ethereum dataset is notably distinct from the Bitcoin dataset:
- The Ethereum blockchain’s primary crypto-economic unit of value is Ether, while the Bitcoin blockchain’s unit of value is Bitcoin. However, the majority of value transfer on the Ethereum blockchain is composed of so-called tokens. Tokens are created and managed by smart contracts.
- Ether value transfers are precise and direct, resembling accounting ledger debits and credits. This is in contrast to the Bitcoin value transfer mechanism, for which it can be difficult to determine the balance of a given wallet address.
- Addresses can be not only be wallets that hold balances, but can also contain smart contract bytecode that allows the programmatic creation of agreements and automatic triggering of their execution. An aggregate of coordinated smart contracts could be used to build a decentralized autonomous organization.
The Ethereum blockchain data are now available for exploration with BigQuery. All historical data are in the ethereum_blockchain dataset, which updates daily. The Ethereum ETL project on GitHub contains all source code used to extract data from the Ethereum blockchain and load it into BigQuery—we welcome more contributors and more blockchains!
Why make Ethereum blockchain data available on Google Cloud?
While the Ethereum blockchain peer-to-peer software has an API for a subset of commonly used random-access functions (for example: checking transaction status, looking up wallet-transaction associations, and checking wallet balances, for example), API endpoints don’t exist for easy access to all of the data stored on-chain.
Perhaps more importantly, API endpoints also don’t exist for viewing the blockchain data in aggregate. Here’s an example chart that shows the total Ether transferred and average transaction cost, aggregated by day:
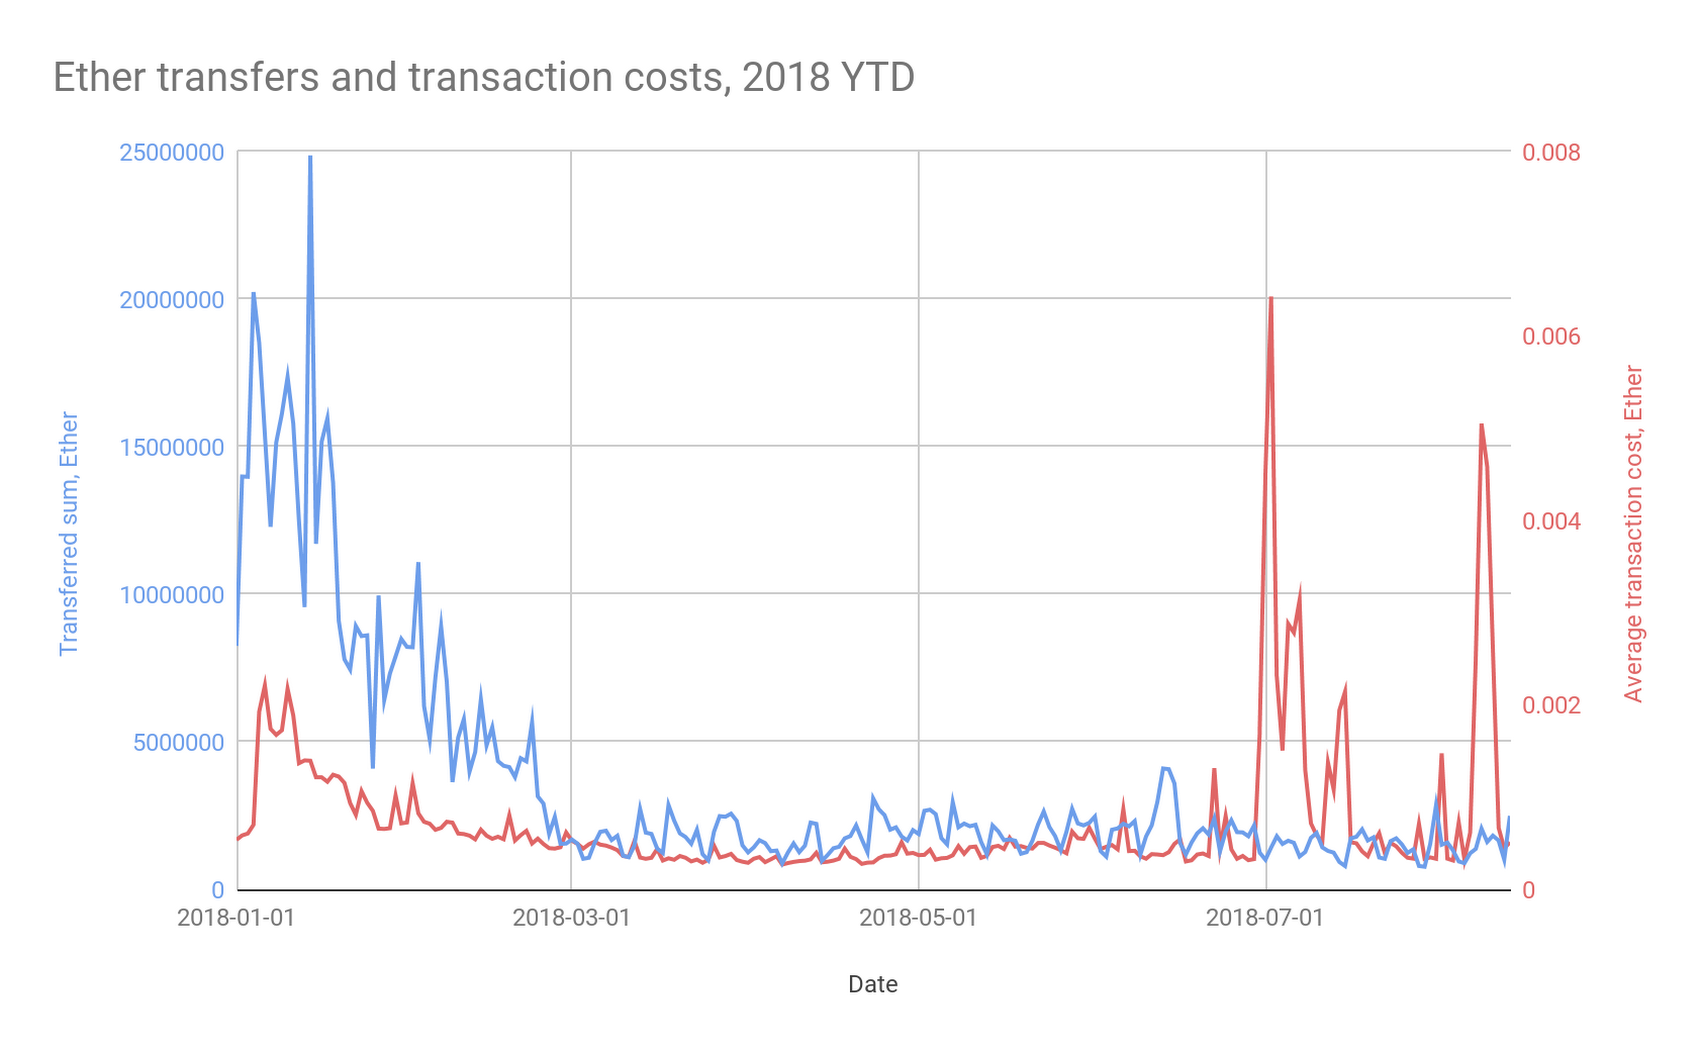
A visualization like this (and the underpinning database query) is useful for making business decisions, such as prioritizing improvements to the Ethereum architecture itself (is the system running close to capacity and due for an upgrade?) to balance sheet adjustments (how quickly can a wallet be rebalanced?).
BigQuery has strong OLAP capabilities to support this type of analysis, ad-hoc and in general, without requiring additional API implementation.
Accordingly, we built a software system on Google Cloud that:
- Synchronizes the Ethereum blockchain to computers running Parity in Google Cloud.
- Performs a daily extraction of data from the Ethereum blockchain ledger, including the results of smart contract transactions, such as token transfers.
- De-normalizes and stores date-partitioned data to BigQuery for easy and cost-effective exploration.
The Ethereum blockchain dataset is also available on Kaggle here. You can query the live data in Kernels, Kaggle’s no charge in-browser coding environment, using the BigQuery Python client library. Fork this example kernel to experiment with your own copy of the Python code.
Interesting queries and analyses
Below, we show a number of interesting queries and visualizations based on the Ethereum dataset. Our analyses focus on three popular topics:
- Smart contract function calls
- On-chain transaction time-series and transaction networks
- Smart contract function analytics
Analysis 1: Popular Smart Contracts Event Logs
The main use case for the Ethereum blockchain has so far been the exchange of digital tokens. Below we demonstrate querying the dataset’s transactions and contracts tables to find the most popular smart contracts, as measured by transaction count:
What are the 10 most popular Ethereum collectibles (ERC-721 contracts), by number of transactions? View my query here.
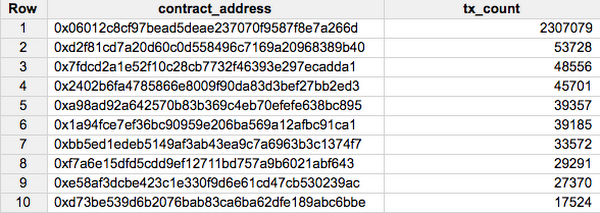
The most popular ERC-721 smart contract by transaction count is 0x06012c8cf97bead5deae237070f9587f8e7a266d, the main smart contract for the CryptoKitties game. We’ll take a look at some attributes of the game later in this document.
Looking more closely at this contract’s source code, it logs a CryptoKitty birth event to the blockchain. You can query the logs table for instances of this event here.
We can visualize the CryptoKitty pedigree, as shown here for accounts that own at least 10 CryptoKitties. Color indicates owner, while size indicates the PageRank (reproductive fitness) of each CryptoKitty:
Analysis 2: Transaction Volumes and Transaction Networks
There are many types of tokens being distributed on the Ethereum blockchain, and their patterns of distribution vary by type and also by time. By looking at each token’s transaction activity, we can measure which are more popular in aggregate or within a given time frame.
Here’s a query to measure an aggregate token statistic: which are the 10 most popular Ethereum tokens (ERC20 contracts), by number of transactions? Find the answer here.
At position #5, one of the most popular tokens is OmiseGO ($OMG) at address 0xd26114cd6ee289accf82350c8d8487fedb8a0c07.
As a follow-up, here’s a query for measuring a token statistic (transaction count) by time window, specifically the daily count of $OMG tokens transfers, and a Data Studio visualization of these data as a time series from inception through August 2, 2018 from this Google Sheet:
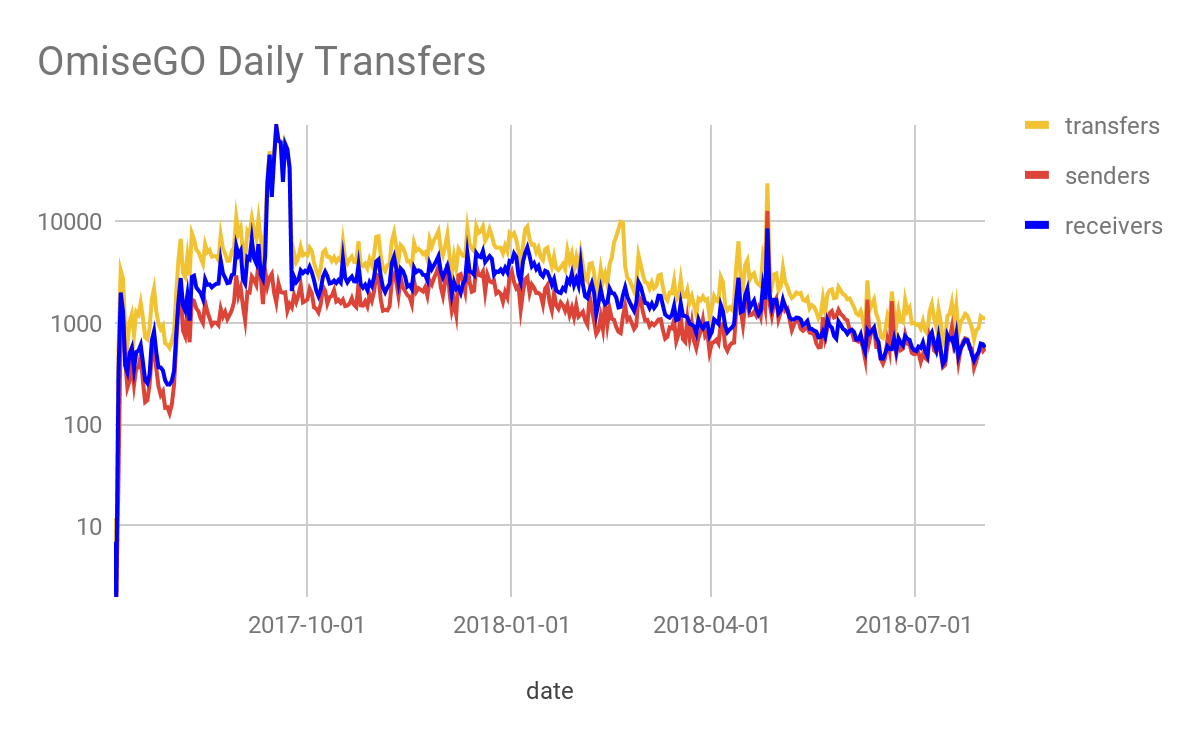
Note that on September 13, 2017, there was a large increase in the number of $OMG receivers but no increase in the number of senders. This corresponds to the beginning of the OmiseGO Token Airdrop.
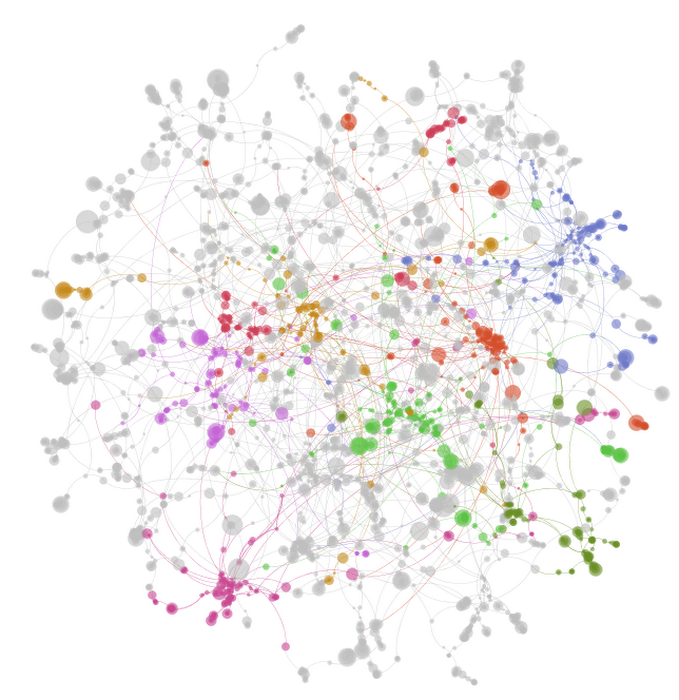
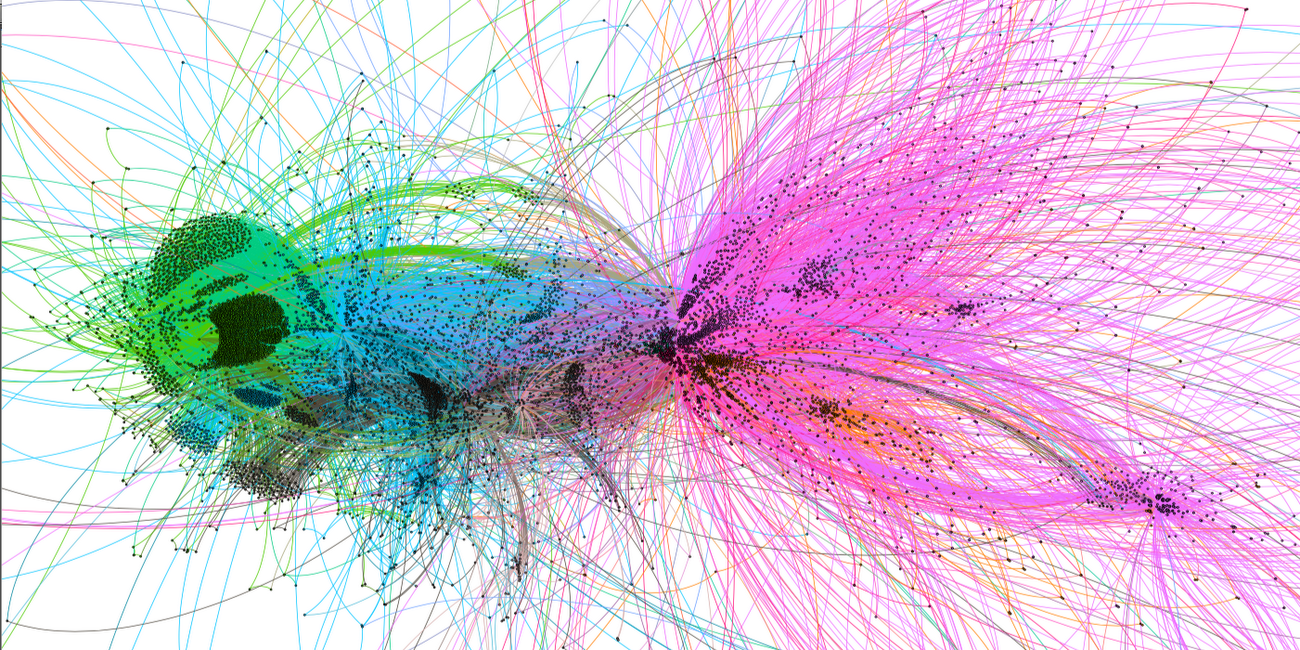
Because the data, at a highly granular level, consists of a set of transfers between wallet addresses, we can also reason about the data using a directed graph data structure.
Here’s a visualization of a subset of the same data: it’s the first 50,000 transactions that had at least two trading partners. In this graphic, nodes (points) represent wallet addresses on the Ethereum blockchain, and edges (lines) represent aggregate transfer of tokens between a pair of addresses. Edge length is approximately proportional to the number of tokens transferred, meaning wallets that transfer more aggregate tokens between them are closer together in the chart. Further groups of addresses that transfer often with one another—to the exclusion of members of other groups—will cluster together, and we’ve color coded these groups for clarity. This graphic was made with Gephi and nodes are color-labeled by groups calculated using the Modularity algorithm.
Analysis 3: Analysis of Smart Contract Functionality
We mentioned previously that many of the smart contracts on the Ethereum blockchain are ERC-20 contracts. What does this mean? ERC-20 simply defines a software interface that smart contracts can implement. Specifically, it’s composed of a few functions related to token transfer, fully described in the ERC20 Token Standard specification document.
There are many other functions that can be implemented by a smart contract. Fortunately, many smart contracts’ source code is freely available to use (open source). We can use this to gain some knowledge about what other contracts do from the name of the function, even for those of which we don’t have the source code, because common function names will share a common signature.
Coming back to the CryptoKitties, discussed in Analysis 3 above, the major element of gameplay is animal husbandry, and the mixing of genes in a breeding event is implemented in the CryptoKitties GeneScience smart contract, 0xf97e0a5b616dffc913e72455fde9ea8bbe946a2b. Suppose we wanted to find other games also implementing similar gameplay mechanics to the CryptoKitties GeneScience contract? We can measure this using a JavaScript UDF implementation of the Jaccard similarity coefficient in this query.
These results reveal that several earlier versions of the GeneScience contract are most similar to the current version of the smart contract at address 0xf97e0a5b616dffc913e72455fde9ea8bbe946a2b. But there are also some others (e.g. CryptoPuppies at 0xb64e6bef349a0d3e8571ac80b5ec522b417faeb6), that appear to be highly similar contracts, as measured by method signatures.